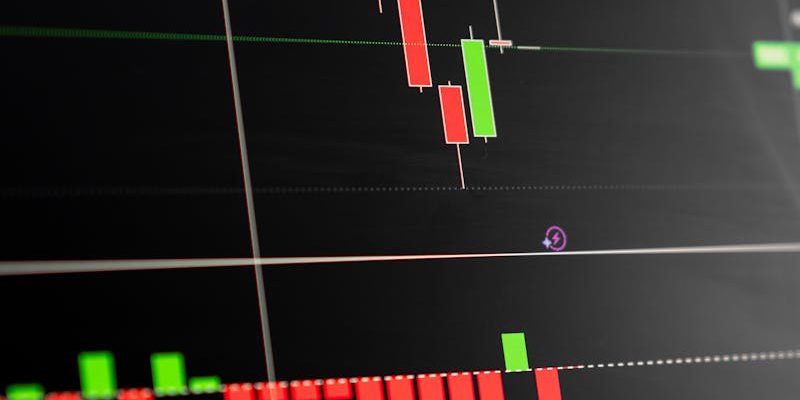
How to Identify a Morning Star
• Three-candle pattern: The Morning Star consists of exactly three candles forming in sequence. It cannot be identified from a single candle and requires the complete three-candle structure to be valid.
• First candle is long and bearish: The first candle is a full-sized red (bearish) candle that continues the prevailing downtrend. Its large body confirms that sellers are still in control and pushing price lower with conviction.
• Second candle is small-bodied with a gap down: The star candle has a small body (it can be a Doji, Spinning Top, or any small-bodied candle) and ideally gaps down from the first candle's close. This small body signals that selling momentum has stalled and indecision has entered the market.
• Third candle is long and bullish, closing above the first candle's midpoint: The final candle is a full-sized green (bullish) candle. Critically, it must close above the midpoint (halfway mark) of the first bearish candle's body. This confirms that buyers have decisively taken control and reversed the selling pressure.
How to Trade the Morning Star
Entry
Enter long on the close of the third candle or at the open of the fourth candle. The third candle's close above the first candle's midpoint confirms the pattern. More aggressive traders enter during the third candle once it crosses the midpoint.
Stop-Loss
Place your stop below the low of the second (star) candle. This is typically the lowest point of the entire pattern and represents the level where the bullish thesis is completely invalidated.
Target
Target the next resistance level or use a minimum 1:2 risk-to-reward ratio. The high before the downtrend started is a natural target. Some traders also use the height of the pattern projected upward.
Success Rate
The Morning Star is one of the most reliable candlestick reversal patterns, with a roughly 78% success rate. Its three-candle structure provides built-in confirmation, making it significantly more dependable than single-candle patterns like the Hammer or Doji. The pattern works best on daily and weekly charts, at established support zones, and when the third candle is accompanied by above-average volume. The deeper the third candle closes into the first candle's body (ideally above the 50% midpoint), the stronger the reversal signal. A true gap between the first and second candles further increases reliability.
Frequently Asked Questions
Related Patterns
Related Tools & Guides
Part of our Technical Analysis Guide