Doji Candlestick Pattern - How to Identify & Trade

Doji Candlestick Pattern

A single-candle pattern signaling market indecision and potential trend reversal.

Neutral Reversal
Open = Close Upper Shadow Lower Shadow Reversal DOJI

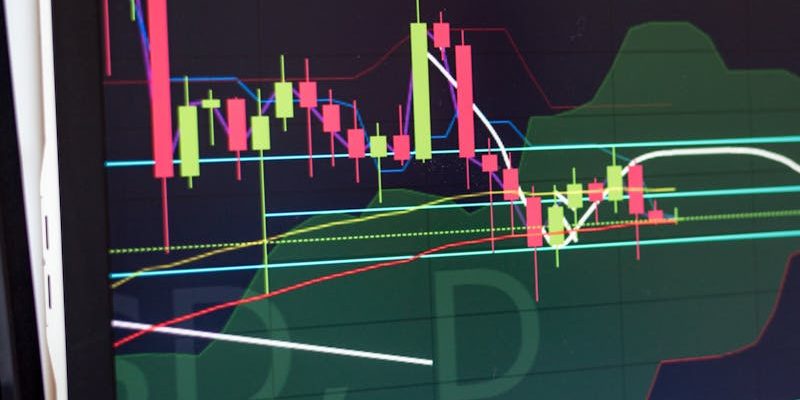
How to Identify a Doji

Open equals close: The opening and closing prices are virtually identical, creating an extremely small or nonexistent body. The body should be less than 5% of the total candle range.

Long upper and lower shadows: Both wicks extend significantly above and below the body, showing that price moved sharply in both directions during the session before settling back near the open.

Appears after a sustained trend: A Doji is most meaningful when it forms after several consecutive bullish or bearish candles. In the middle of a consolidation, a Doji carries much less significance.

Signals indecision: The pattern tells you that the balance of power between buyers and sellers has temporarily equalized. Neither side could maintain control by the close, suggesting the prevailing trend may be losing momentum.

How to Trade the Doji

Entry

Wait for the next candle to confirm direction. Enter short below the Doji low (bearish reversal) or long above the Doji high (bullish reversal). Never trade the Doji candle alone.

Stop-Loss

Place your stop above the Doji high for short trades, or below the Doji low for long trades. The stop should capture the full range of the indecision candle.

Target

Aim for the next support level (bearish) or resistance level (bullish). A minimum 1:2 risk-to-reward ratio is recommended. Previous swing highs/lows make excellent targets.

Success Rate

50%
Historical success rate as a standalone signal

On its own, the Doji is essentially a coin flip because it signals indecision, not direction. However, when confirmed with the next candle and supported by volume analysis, the success rate climbs to 65-70%. The Doji performs best on daily and weekly timeframes, at established support or resistance zones, and when volume spikes on the confirmation candle. Avoid trading Dojis on intraday charts below 4 hours where they appear far too frequently to be meaningful.

Frequently Asked Questions

A Doji is a candlestick pattern where the opening and closing prices are virtually equal, resulting in a very small or nonexistent body. The long upper and lower shadows indicate that both buyers and sellers were active during the period, but neither side won. It signals market indecision and often appears at turning points in trends.
There are four main types: the standard Doji has roughly equal upper and lower shadows. The Long-Legged Doji has extra-long shadows showing extreme indecision. The Dragonfly Doji has a long lower shadow with no upper shadow and is bullish when found at market bottoms. The Gravestone Doji has a long upper shadow with no lower shadow and is bearish when found at market tops.
A Doji is inherently neutral. Its significance depends entirely on context. After an uptrend, a Doji suggests the bulls are losing steam and a bearish reversal may follow. After a downtrend, it suggests selling pressure is fading and a bullish reversal may occur. Always wait for the next candle to confirm the direction before entering a trade.
Doji patterns are most reliable on daily and weekly charts where each candle represents significant price action. On intraday charts (1-minute, 5-minute), Dojis are extremely common and produce many false signals. The 4-hour chart is the minimum recommended timeframe. Swing traders and position traders get the most consistent results from Doji signals.
Both patterns indicate indecision, but a Doji has virtually no body (open equals close), while a Spinning Top has a small but visible body. The Spinning Top shows that one side had a slight edge, whereas the Doji shows a perfect stalemate between buyers and sellers. Because of this, Dojis are generally considered stronger reversal signals than Spinning Tops.

Related Patterns

Related Tools & Guides

Part of our Technical Analysis Guide